Australia’s debt service ratio ‘extraordinary’: CBA

The change in the debt service ratio has been ‘extraordinary’, according to the major bank.

.

The Commonwealth Bank of Australia’s (CBA) latest report into the Australian household sector when compared to other countries has found that Australia’s debt-to-service ratio currently sits at a record high.

The debt servicing ratios are based on the methodology derived from the Bank of International Settlements (BIS), which reflects the share of income used to service debt for households, non-financial corporations, and the total private non-financial sector.

According to CBA head of Australian economics Gareth Aird, the combination of more household indebtedness and a “predominantly floating rate mortgage market” has seen the debt service ratio rise “more swiftly in Australia than in any other region”.

Aird added that the cumulative change in the debt service ratio in Australia since the global co-ordinated tightening cycle began is “extraordinary relative to other jurisdictions”.

“The change in debt service ratios captures the impact of the magnitude of the hit to household finance from monetary policy,” Aird added.

“The change in the debt service ratio in Australia since 2022 dwarfs that of any other major region due to the structure of the mortgage market and directness of the transmission of monetary policy.”

The International Monetary Fund (IMF) reflected on this sentiment as fixed-rate mortgages have gained more global prevalence.

“Our results indicate that monetary policy has greater effects on activity in countries where the share of fixed-rate mortgages is low,” IMF said.

“This is due to home owners seeing their monthly payments rise with monetary policy rates if their mortgage rates adjust.

“By contrast, households with fixed-rate mortgages will not see any immediate difference in their monthly payments when policy rates change.”

Furthermore, the effects of monetary policy were found to be stronger in countries where mortgages are larger compared to home values and in countries where “household debt is high as a share of GB, according to the IMF.

“In such settings, more households will be exposed to changes in mortgage rates, and the effects will be stronger if their debt is higher relative to their assets,” IMF said.

While Australia’s debt levels remain higher than in most major regions, the Reserve Bank of Australia (RBA) found that the majority of borrowers are still able to service repayments on time.

In its Financial Stability Review – March 2024, the RBA noted that although housing and personal loan arrears have increased since late 2022, they still remain below pre-pandemic levels, however, the central bank has noticed a rising share of borrowers requesting temporary hardship arrangements from lenders.

In turn, this has contributed to arrear rates remaining “a little lower” than would have otherwise been the case.

Australia’s banks expect arrears to continue to rise but still remain at historical lows.


Adrian Suljanovic
15 April 2024
mortgagebusiness.com.au

Investment and economic outlook, April 2024

Our region-by-region economic outlook and latest forecasts for investment returns.


.

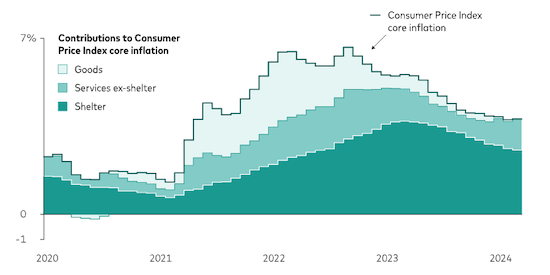
U.S. Consumer Price Index (CPI) data for March underscore the challenge faced by Federal Reserve policymakers as they try to guide inflation down toward their 2% target. Getting there would require a slower pace of growth for two especially sticky CPI components—shelter and services excluding shelter. Without progress on those fronts, the Fed may not be able to cut its benchmark interest rate target.

The “last mile” of inflation reduction will require progress on shelter and services

Note: The chart shows year-over-year rates of change in the core U.S. Consumer Price Index, which excludes food and energy prices, starting in January 2020 and ending in March 2024. It also breaks those rates of change into three sources. Last month, according to the core CPI, shelter prices were 5.7% higher than they had been one year earlier. Shelter accounted for more than two-thirds of the 3.8% rise in total core CPI.

Sources:  calculations using data from Refinitiv, as of 31 March, 2024.

Price increases for services excluding shelter have accelerated since December, propelled by a tight labour market and strong wage growth. Meanwhile, a year-long slowdown in the pace of shelter inflation has not been sharp enough to comfort the Fed. “Shelter inflation is critical to core inflation reaching the Fed’s target,” said Ryan Zalla, an economist who studies price behavior. “If shelter inflation were to return to its prepandemic average of around 2.5%, core CPI would be approximately 2%.”

Stubborn shelter prices reflect heightened housing demand, supported by a strong labour market, and low supply, abetted by the reluctance of many homeowners to give up low mortgage rates by moving. “For shelter inflation to moderate, labour market conditions will have to materially weaken, or housing supply will have to increase,” Zalla said. “Meaningful changes in either appear unlikely to materialise soon.”

The views below are those of the global economics and markets team.

Outlook for financial markets

Our 10-year annualised nominal return and volatility forecasts are shown below. Equity returns reflect a range of 2 percentage points around the 50th percentile of the distribution of probable outcomes. Fixed income returns reflect a 1-point range around the 50th percentile. More extreme returns are possible.

Australian dollar investors

  • Australian equities: 4.3%–6.3% (21.7% median volatility)
  • Global equities ex-Australia (unhedged): 4.9%–6.9% (19.4%)
  • Australian aggregate bonds: 3.7%–4.7% (5.5%)
  • Global bonds ex-Australia (hedged): 3.9%–4.9% (4.8%)

Notes: These probabilistic return assumptions depend on current market conditions and, as such, may change over time.

Source: Investment Strategy Group.

IMPORTANT: The projections or other information generated by the Capital Markets Model regarding the likelihood of various investment outcomes are hypothetical in nature, do not reflect actual investment results, and are not guarantees of future results. Distribution of return outcomes from the VCMM are derived from 10,000 simulations for each modeled asset class. Simulations are as of 31 December, 2023. Results from the model may vary with each use and over time.

Region-by-region outlook

Australia

Sticky rent prices and a still-tight labour market position the Reserve Bank of Australia (RBA) to be among the last developed market central banks to ease policy rates. We expect the RBA to cut the cash rate by 50 basis points, to 3.85%, by year-end, and that the rate eventually will settle in the 3%–4% range, in line with our assessment of the neutral rate—the theoretical rate that would neither stimulate nor restrict the economy.

  • We foresee both headline and core inflation falling to around 3% year over year by the end of 2024, down from 3.4% and 3.9% on a “trimmed mean” basis, respectively, in February. We expect inflation to fall to the midpoint of the RBA’s 2%–3% target range in 2025.
  • We forecast a year-end unemployment rate of about 4.6%, as financial conditions tighten amid elevated interest rates. It was 3.7% in February.
  • Leading indicators suggest that broad economic activity is marginally below our estimate of trend or sustainable growth. We expect rising real household income, a reflating housing market, and improving business and consumer sentiment to support a gradual acceleration in growth. We continue to expect that Australia will avoid recession in 2024, with below-trend GDP growth of about 1%.

United States

The latest inflation and labour market data imply that U.S. production of goods and services remains healthy and underscore our view that continued economic strength might prevent the Federal Reserve from cutting interest rates in 2024.

  • Measured by the Consumer Price Index, services prices were 5.3% higher on a year-over-year basis in March. Headline inflation advanced 3.5% year over year. We expect the Fed’s preferred inflation gauge, the core Personal Consumption Expenditures (PCE) index, which excludes food and energy prices due to their volatility, to record full-year 2024 inflation of about 2.6%.
  • The U.S. labour market remains irrefutably strong. Workers on private nonfarm payrolls earned an average of $34.69 per hour in March, up 4.1% year over year and above the 3%–3.5% annual rate that we view as noninflationary. We forecast a modest rise in the unemployment rate—from 3.8% to about 4%—by year-end.
  • We expect real (inflation-adjusted) U.S. economic growth of about 2% in 2024, higher than our initial estimate of about 0.5%.

China

China’s economy appeared to have made a solid start to 2024. But already questions have arisen about the sustainability of its growth after the second quarter, when year-over-year comparisons will be relatively easy.

  • Economic growth had softened by the second quarter of 2023, as the unleashing of strong, pent-up demand post-COVID couldn’t be maintained. That soft patch will flatter year-over-year performance in this year’s second quarter. Continued strong growth increases the prospect that, with its full-year growth target of “about 5%” well in sight, China may not address underlying economic imbalances.
  • Structural imbalances are likely to remain given the government’s policy priorities for investment and manufacturing upgrades over more direct measures to support consumer spending. We expect resulting supply-and-demand imbalances to continue to add to deflationary pressure amid weak consumer demand. To mitigate deflationary pressure, we forecast that the People’s Bank of China will cut its policy rate from 2.5% to 2.2% in 2024 and trim banks’ reserve requirement ratios.
  • We foresee elevated real (inflation-adjusted) interest rates continuing to weigh on prices. We recently lowered our forecast for full-year core inflation from a range of 1%–1.5% to 1% and our forecast for headline inflation from 1.5%–2% to less than 1%, well below the central bank’s 3% inflation target.

Euro area

Speaking on April 11, European Central Bank (ECB) President Christine Lagarde emphasised that the ECB would be “data-dependent, not Fed-dependent” in considering the appropriate policy rate. Her reference was to the risk that, by maintaining its current rate target for an extended period, the U.S. Federal Reserve could spur other central banks to leave their rate targets higher than they otherwise might. Cross-border gaps in policy rates can put downward pressure on currencies where rates are lower, increasing inflation risk.

  • Expects the ECB to trim its interest rate target by 25 basis points at each of its five remaining 2024 policy meetings, but rising energy prices skew risks toward a slower pace of easing. (A basis point is one-hundredth of a percentage point.) In our baseline case, the ECB’s policy rate ends 2024 in the 2.5%–3% range.
  • The euro area’s economy is showing tentative signs of having bottomed in the fourth quarter of 2023. We continue to expect 2024 economic growth of just 0.5%–1% amid still-restrictive monetary and fiscal policy and the lingering effects of Europe’s energy crisis.
  • The confluence of moderating wage growth, inflation expectations that remain in check, and lackluster demand supports our expectation that headline inflation will fall to 2% by September 2024 and core inflation will reach that same target by December. Headline prices were up 2.4% on a year-over-year basis in March. Core prices, which exclude the volatile food, energy, alcohol, and tobacco sectors, were up 2.9%.
  • We expect the unemployment rate to end 2024 around its current 6.5% level. The labour market may be softer than the unemployment rate would suggest, however; job vacancy rates, though still high, have receded, labour hoarding remains elevated, and the number of hours worked has stagnated.

United Kingdom

A continued moderation in wage growth and encouraging inflation news could set the stage for policy interest rate cuts this summer. Growth in average regular pay, which excludes bonuses, slowed to 6.0% between December and February, a sixth consecutive moderation in the rolling, three-month measure.

  • A reduction in the maximum price that energy suppliers can charge for a unit of energy should support falling headline inflation. Ofgem, Great Britain’s independent energy regulator, reduced its energy price cap for the April-June 2024 period by 12% following recent falls in wholesale energy prices. However, we’re watching crude oil prices amid heightened tension in the Middle East. We foresee headline inflation falling to just below 2% and core inflation falling to about 2.6% by year-end. The latest year-over-year readings, for March, were 3.2% and 4.2%, respectively.
  • Encouraging wage and inflation data underscore our view that the Bank of England will begin a series of interest rate cuts beginning in August, with the bank rate falling by a percentage point to 4.25% by year-end.
  • GDP data for January and February suggest the U.K. economy is emerging from a brief recession in the second half of 2023. We recently lowered our forecast for 2024 GDP growth to about 0.3%, down from an initial range of 0.5%–1%.
  • As in the euro area, the labour market’s gradual loosening appears mainly driven by reduced vacancies and fewer hours worked, rather than an increase in unemployment. We recently lowered our year-end 2024 unemployment rate forecast from 4.5%–5% to 4%–4.5%.

Emerging markets

Amid continued strength in the U.S. economy, we have upgraded our 2024 GDP growth forecast for Mexico. U.S. demand for Mexican goods has remained strong, and domestic wages and consumption are holding up. Our revised forecast is for 1.75%–2.25% growth, up from 1.5%–2% but still below trend amid restrictive monetary policy.

  • We continue to expect the world’s emerging markets to deliver economic growth of about 4%, on average, this year, led by growth of about 5% for emerging Asia.
  • We forecast growth in the 2%–2.5% range for emerging Europe and Latin America, though U.S. growth could have positive implications for Mexico and all of Latin America.
  • We expect that Mexico’s core rate of inflation will fall to 3.6%–3.8% and that the Banco de México will cut the overnight interbank rate to 9%–9.5% by year-end.

Canada

Canada’s economy avoided recession in the fourth quarter of 2023, thanks to the strongest population growth since 1957, which fueled consumption, and U.S. economic resilience, which buoyed exports. We continue to foresee below-trend growth in 2024 but have increased our growth forecast from about 1% to a range of 1.25%–1.5%. Risks skew to the downside amid the continued bite from restrictive monetary policy.

  • We expect that the Bank of Canada (BOC) will trim its overnight rate by 50 to 75 basis points this year, to a year-end range of 4.25%–4.5%. (A basis point is one-hundredth of a percentage point.) The first cut is likely to be announced on June 5, after the next central bank policy meeting.
  • As in the U.S., the “last mile” of inflation reduction could be the most challenging. We continue to foresee core inflation falling to a year-over-year pace within the BOC’s target range of 2%–2.5% by the end of 2024, with house prices moderating in response to declining affordability. Shelter prices, up 6.5% on a year-over-year basis last month, remain an upside risk amid immigration-fueled population growth.
  • Amid weak economic growth, we forecast that the unemployment rate will end 2024 in the 6%–6.5% range. It was 6.1% last month.

IMPORTANT: The projections and other information generated by the Vanguard Capital Markets Model® regarding the likelihood of various investment outcomes are hypothetical in nature, do not reflect actual investment results, and are not guarantees of future results. VCMM results will vary with each use and over time.

The VCMM projections are based on a statistical analysis of historical data. Future returns may behave differently from the historical patterns captured in the VCMM. More important, the VCMM may be underestimating extreme negative scenarios unobserved in the historical period on which the model estimation is based.

The Vanguard Capital Markets Model is a proprietary financial simulation tool developed and maintained by Vanguard’s primary investment research and advice teams. The model forecasts distributions of future returns for a wide array of broad asset classes. Those asset classes include U.S. and international equity markets, several maturities of the U.S. Treasury and corporate fixed income markets, international fixed income markets, U.S. money markets, commodities, and certain alternative investment strategies. The theoretical and empirical foundation for the Vanguard Capital Markets Model is that the returns of various asset classes reflect the compensation investors require for bearing different types of systematic risk (beta). At the core of the model are estimates of the dynamic statistical relationship between risk factors and asset returns, obtained from statistical analysis based on available monthly financial and economic data from as early as 1960. Using a system of estimated equations, the model then applies a Monte Carlo simulation method to project the estimated interrelationships among risk factors and asset classes as well as uncertainty and randomness over time. The model generates a large set of simulated outcomes for each asset class over several time horizons. Forecasts are obtained by computing measures of central tendency in these simulations. Results produced by the tool will vary with each use and over time.

This article contains certain 'forward looking' statements. Forward looking statements, opinions and estimates provided in this article are based on assumptions and contingencies which are subject to change without notice, as are statements about market and industry trends, which are based on interpretations of current market conditions. Forward-looking statements including projections, indications or guidance on future earnings or financial position and estimates are provided as a general guide only and should not be relied upon as an indication or guarantee of future performance. There can be no assurance that actual outcomes will not differ materially from these statements. To the full extent permitted by law, Vanguard Investments Australia Ltd (ABN 72 072 881 086 AFSL 227263) and its directors, officers, employees, advisers, agents and intermediaries disclaim any obligation or undertaking to release any updates or revisions to the information to reflect any change in expectations or assumptions.


Vanguard
April 24

vanguard.com.au


What is the future of advice and how far off is superannuation 2.0?

Financial advice can make a massive difference in people’s lives. We know this because we see every day in our data just how much better off people are when they follow the advice. But up until now, the majority of Australians haven’t been able to afford it. As a consequence, most Aussies are unaware of what advice is and how it can help them be better off.

.

So, what does the future of personal financial advice look like? Well, for starters, we need to tackle the issue of supply and demand. Right now, there simply aren’t enough advisers to help the people who need it – and that’s pretty much every working Australian. So, along with the existing advisers, digital advice needs to be available to ensure every Aussie has access to advice whenever they need it, so they can make smart decisions about their money. In the future, advice will be ubiquitous with everyone having the tools and information they need to take control of their finances. A digital companion that understands your current situation and guides you based on what you need will become the new normal.

In this world, the advice changes as your financial circumstances also change. The only priority is for you to be better off. In the context of your current situation and your goals. It’s not looking to sell you products but rather reach your goals sooner, while ensuring you utilise the “rules of the game”, guiding you within the existing legislation.

Just like Spotify and Netflix revolutionised how we consume entertainment, technology will once again revolutionise the personal financial advice industry so that everyone can enjoy the benefits of personal financial advice, which will make every Australian better off.

But how do we land in this world where personal financial advice is available to everyone?


Well, we need technology. We need technology that works within the regulatory framework yet is still affordable to the majority of Australians. We need technology that puts people, not products, as the most important factor. We need technology that can guide everyday Australians, at any given time in their lives, on ways to pay off debt faster, save for something you love, boost your super and set you up for your future, sort out your insurance and organise your money based on your personal needs. When we all have access to personal financial advice, as a society, we will have less financial stress, less pressure on the federal government, a stronger economy which will snowball to every Australians’ financial situation getting stronger.

And who can help us get there? The most trusted institution that every working Australian has access to – superannuation funds.

In December last year, the government announced that super funds are expected to provide quality advice to their members. However, to meet the scale of Australians who require that advice, we’ll need to look at a licensed, quality digital solution that can work cohesively with human financial advisers.

There’s no doubt in my mind that super funds offering personal financial advice to members, through revolutionising technology, is the only way we can ensure Australians have access to advice at scale. Does that mean we’re on the cusp of superannuation 2.0, and if so, what does this new world look like?


This is what I think:

1. We’ll live in a world where everyone understands advice

New research from the CFS in The Empowered Australian Report 2023 showed that one in three Australians who have never received advice cannot articulate a single benefit of receiving financial advice. This isn’t a surprise. There is no doubt unadvised consumers lack knowledge of the benefits of advice and how this would positively impact their lives. How can we know the benefits of something, if we’ve never experienced it?

Flip that on its head, advised Australians understand the value of the advice they pay for. So in this new world, all Australians will see and experience the value of personal financial advice.

2. Super funds will have a better report card

In this new world, super funds meet their obligations and no doubt have a better report card when the Australian Prudential Regulation Authority (APRA) and the Australian Securities and Investments Commission (ASIC) complete their retirement income covenant (RIC) reviews.

In this world, super funds understand what members are seeking from their super fund alongside the obligations placed upon them by the RIC. The most recent Otivo superannuation report showed that nine out of 10 Australians would like their super funds to provide advice on issues that affect their ability to add to their super fund, and more than half (53 per cent) of members want their fund to offer advice, while almost eight in 10 (79 per cent) want their super fund to be more proactive in providing advice.

In this new world, super funds are meeting these needs through revolutionised technology that helps them do better by their members.

3. Superannuation funds can truly become member-first

Gone are the days when super funds serve as just a mechanism for our retirement savings. This new world of superannuation sees funds emerge as dynamic hubs of financial education and empowerment. You’ll be able to grow your super, budget and plan for your retirement.

The technology that powers this change will be created by those in financial advice, finance, government, superannuation, compliance and technology, all working together to produce quality financial advice to help all Australians be better off.

4. A changed perception of money and how we handle it

Superannuation 2.0 will see us enjoy a shift that holds the promise of transforming the way we perceive and manage our money. We’ll all get to enjoy real-time tips to help us proactively reduce our taxes and enhance our savings, while preparing for our retirement. And this won’t be available to just those who can afford it; thankfully, we’ll all be able to receive quality, comprehensive advice that is accessible. Just as it should be.

We’ll also be able to support Australians to understand the value of planning for retirement. We’ll be able to tackle data that shows 81 per cent of Australians rely solely on their employer superannuation contributions to increase their super savings. We’ll have younger Australians considering their future, so retirement is less likely to feel overwhelming and unmanageable.

5. Super funds will become proactive partners in our financial journeys

With the support of digital financial advice, super funds will be in a position to become proactive partners in our financial journeys. Imagine signing up for a super fund and being given access to bespoke financial roadmaps tailored to your unique goals and financial circumstances. Superannuation 2.0 equips us all with the tools and knowledge to make informed financial decisions.

Data will be critical to guiding and informing, and AI will become the new norm. This data will proactively identify issues before you even see them yourself. It will also help you choose an appropriate investment for your super; it will guide you on the best options when it comes to topping up your super and how long your funds may last in retirement and it will determine an appropriate type and level of cover for your needs. With that information changing as your financial circumstances also change.

6. Digital financial advice will work with humans, after all, that’s when technology works best

There is no doubt that some level of adviser interaction will always be required. Quality financial advisers, as we know them, will become specialists and will no doubt continue to offer human services to their clients, with digital advice working alongside the traditional method to support Australians at scale. In my opinion, just like we embraced online shopping and online banking, quality and comprehensive digital financial advice will integrate into our lives in the same way. It will be easier, will be guided by technology to help us, and when we need it, humans will be available to support us as required.


Paul Feeney is the chief executive officer of Otivo.
April 08
ifa.com.au

Getting to a higher level of financial literacy in Australia

The practical benefits of improving financial literacy.

.

This month marks the 20th anniversary since the United States’ government under former President George W. Bush passed legislation officially proclaiming April as Financial Literacy Month.

Financial Literacy Month is quite a big deal in the U.S. Every April, all U.S. state governments, schools, and a wide range of organisations and companies, undertake various initiatives aimed at improving financial literacy, including educational workshops, financial events, and broader marketing activities.

The aim is not just to highlight to Americans the importance of being financially literate, but to give some practical guidance on how people of all ages can improve both their financial knowledge and economic wellbeing.

Australia is not at the same level in terms of having a national, co-ordinated approach to developing financial capabilities across the population.

Government-funded strategies have been limited to date. Private financial education programs are being run in some primary and secondary schools to help students learn about the basics of finance and money. But these programs are not part of the standard school curriculum.

Low literacy levels

The 2020 Household, Income and Labour Dynamics in Australia (HILDA) study, funded by the federal government, found after a survey of around 17,000 Australians that while income and wealth levels here are rising, financial literacy is low in different segments of the population.

The HILDA study included five financial literacy questions covering numeracy, inflation, portfolio diversification, risk versus returns, and money illusion (purchasing power).

Those in older age categories tended to achieve higher scores, although there were large differences in financial literacy scores across demographic groups and between individuals based on their level of education. Not surprisingly, it was lowest among young people aged between 15 and 24.

So, what are the practical benefits of having a good level of financial literary?

At the most basic level, it can help people to better manage their money. But even simple lessons, such as understanding how compounding works and the significant wealth benefits it can deliver over the long term, can have profound outcomes.

Investor levels still surging

It is evident that levels of financial literacy are not necessarily deterring individuals from investing.

According to the Australian Securities Exchange (ASX) Investor Study 2023, 10.2 million Australians were making investments outside of their family home and superannuation on the ASX when it conducted its research in November 2022.

Of those surveyed, around 20 per cent said they had only begun investing since the end of 2020. One-third said their first investment had been individual shares on the ASX, and for 14 per cent their first investment had been into an exchange traded fund (ETF).

Yet, having a higher level of financial literacy can potentially go a long way in guiding people on key principles such as the importance of setting financial goals and minimising costs, the roles of asset allocation and diversification, and the benefits of having a long-term, disciplined investment approach.

At a younger age, learning basic skills such as budgeting and saving can help a person to take their first investment steps, whether that’s saving up a deposit for a house or investing on the share market.

People in their 30s and 40s tend to be focused on securing and expanding their wealth, sometimes increasing their investment exposure to higher-risk assets.

Older age groups – especially those in their 50s nearing retirement or in their 60s who have already retired – can look to tilt their investments towards income-producing assets.

An ongoing process

In reality, building up financial literacy and knowledge at an individual level should be an ongoing process to prepare for different life stages.

These days, many people are learning the basics and building up their knowledge by reading financial books and listening to podcasts.

But one also should not overlook the important role of professional financial advisers in the financial literacy process, to receive considered advice at key life moments.

Many Australians probably recognise the benefits of receiving financial advice, but do not take the actual step of engaging an adviser.

That is a shame, because advice can go a long way to helping people plan well ahead so they can achieve a financially successful retirement.

Typically, an adviser can guide people in a wide range of areas including saving and budgeting, superannuation contributions, investment strategies, debt management, insurance coverage, and estate planning.

There is no doubt that more can be done on a broad co-ordinated level to improve financial literacy across Australia.

At the same time, there are also obvious steps that people can take themselves to improve their knowledge, and that can readily be accomplished with help from a professional adviser. 


By Balaji Gopal, Head of Client Experience, Vanguard
April 24
vanguard.com.au

The compounding benefits from reinvesting dividends

Using income distributions to purchase additional ETF units can significantly compound capital growth and income returns over time.

.

If you invest either directly or indirectly in the biggest companies listed on the Australian share market, there’s a reasonable chance you will soon be receiving some income distributions.

In tandem with announcing their latest half- or full-year financial results to 31 December 2023, 83% of the 200 biggest companies listed on the Australian Securities Exchange (ASX) have declared dividends per share that they will pay out to their shareholders over the next month or so.

Shareholders also include the exchange traded funds (ETFs) that are direct investors in Australian-listed companies. For example, Australia’s largest ETF, the Australian Shares Index ETF (VAS) has shareholdings in the top 300 companies on the ASX and tracks the S&P/ASX 300 Index.

The ASX company dividends received by ETFs such as VAS will be aggregated and then passed through to individual ETF unitholders as income distributions.

How much ETF unitholders are paid depends on the total value of the company dividends received by the ETF and then on the number of individual ETF units held at the time a fund’s distribution payment amount is announced.

The case for reinvesting

When it comes to company income distributions, ETF investors typically have the option of taking their distributions as cash payments or reinvesting the equivalent value of their cash distributions back into additional ETF units.

ETF income distributions are generally made on a quarterly basis, but some ETFs make more frequent income payments.

Taking the cash option often relates to an individual’s income needs. However, the alternative strategy of using income distributions to purchase additional ETF units can significantly compound both capital growth and income returns over time.

Another key advantage of reinvesting income distributions is that there are no additional brokerage fees involved when ETF units are added to an existing holding, meaning lower investment costs and higher returns.

VAS case study

Let’s take a hypothetical investor who invested $10,000 into VAS on 1 January 2014, purchasing 147 units (based on VAS’s $67.83 net asset value per unit at the time).

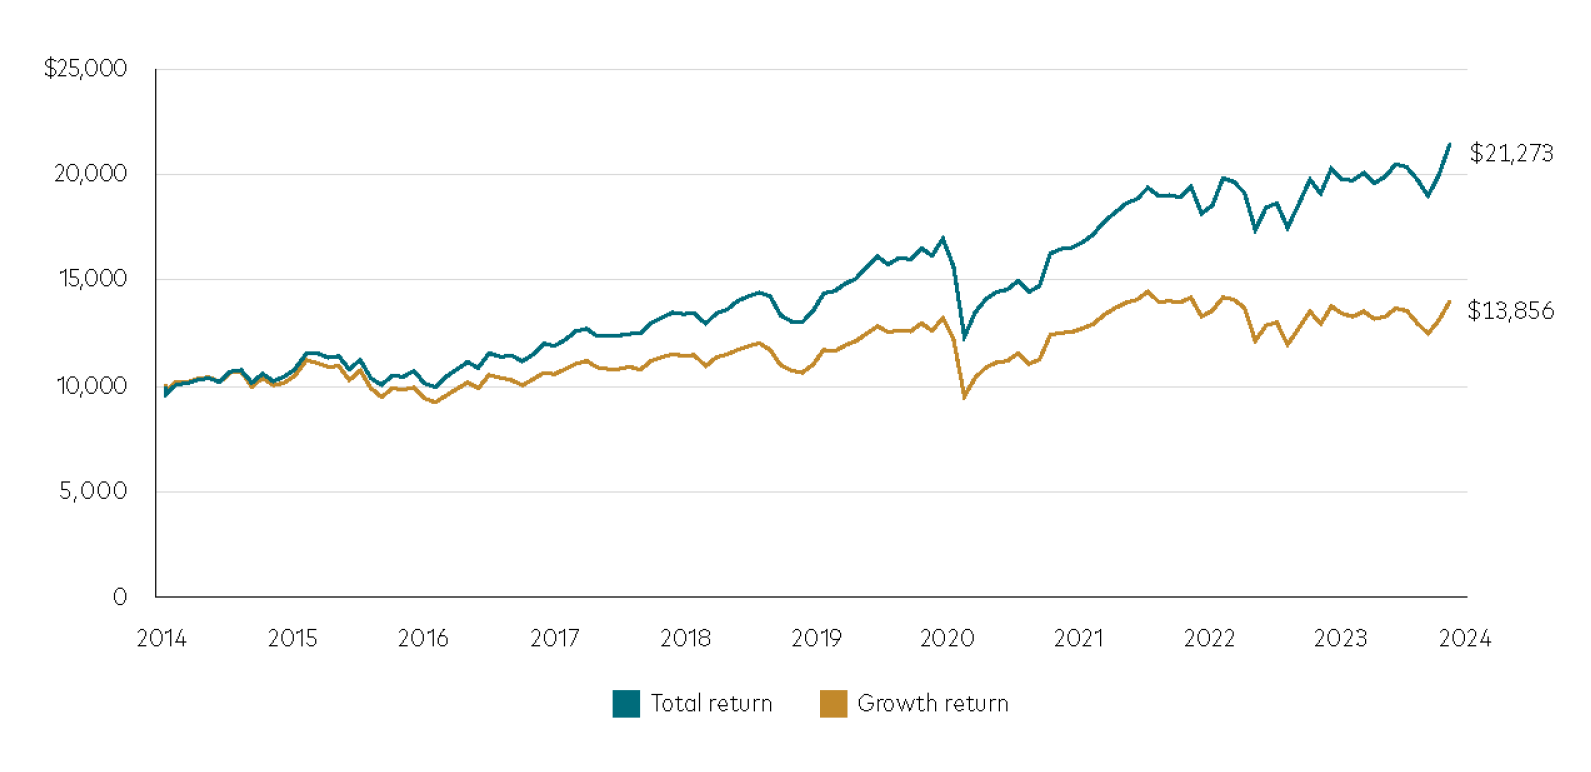
The chart below compares the growth return and the total return from that investment over the 10-year period between 1 January 2014 and 31 December 2023.

The growth return represents the base return from their VAS holding, while the total return includes all the distributions paid by VAS and assumes they were reinvested over the same time period to purchase more VAS units.

10-year investment in VAS with and without reinvestment

Sources: Calculations are based on a $10,000 investment into the  Share Index ETF from 1 January 2014 to 31 December 2023.
Notes: Returns assume that an investor purchased shares at Net Asset Value (NAV) and does not reflect the transaction costs imposed on the creation and redemptions of ETF units, brokerage or the bid ask spread that investors pay to buy and sell ETF securities on the Australian Securities Exchange.
Past performance information is given for illustrative purposes only and should not be relied upon as, and is not, an indication of future performance.

The growth return over the measured period was 38% and would have resulted in the $10,000 initial investment increasing to $13,856 based on VAS’s net asset value per unit of $94.42 at 31 December last year. The hypothetical investor also would have received $4,957 in income distributions over the 10 years.

By comparison, if the investor had chosen to reinvest all their income distributions into additional VAS units, they would have achieved a total return of 113% and their end investment balance at 31 December last year would have grown to $21,273.

On a dollar basis, by including the cash dividends paid out, there would have been an overall difference of about $2,460, or 13.1%.

But the bigger benefit from reinvesting is that the number of ETF units held continued to compound over time.

By using their income distributions to buy additional VAS units, the hypothetical investor’s unitholding would have increased by 78 from the original 147 units to 225 units.

As such, they would have received compounding investment returns over the 10-year period based on the gradual increase in the number of VAS units they held.

The investor also would have saved a significant amount in brokerage fees on the additional ETFs purchased through reinvesting.

This hypothetical comparison demonstrates that investors who consistently reinvest their income distributions will likely achieve higher investment returns over the longer term compared to those who choose to take their distributions as cash.

Investors holding ETFs through a  Personal Investor Account can simply login and update their income preference to ‘reinvest’ to have distributions automatically reinvested.


Important Information

Vanguard Investments Australia Ltd (ABN 72 072 881 086 / AFS Licence 227263) (“Vanguard”) is the issuer of the Vanguard® Australian ETFs. Vanguard ETFs will only be issued to Authorised Participants. That is, persons who have entered into an Authorised Participant Agreement with Vanguard (“Eligible Investors”). Retail investors can transact in Vanguard ETFs through Vanguard Personal Investor, a stockbroker or financial adviser on the secondary market.

We have not taken your objectives, financial situation or needs into account when preparing this publication so it may not be applicable to the particular situation you are considering. You should consider your objectives, financial situation or needs, and the disclosure documents for Vanguard’s products before making any investment decision. Before you make any financial decision regarding Vanguard’s products you should seek professional advice from a suitably qualified adviser. The Target Market Determination (TMD) for Vanguard’s ETFs include a description of who the ETF is appropriate for. You can access our IDPS Guide, PDSs Prospectus and TMD at vanguard.com.au or by calling 1300 655 101.

Past performance information is given for illustrative purposes only and should not be relied upon as, and is not, an indication of future performance.

An investment in Exchange Traded Funds (ETFs) is subject to investment and other known and unknown risks, some of which are beyond the control of Vanguard, including possible delays in repayment and loss of income and principal invested. Please see the risks section of the Product Disclosure Statement (“PDS”) for the Vanguard Australian Shares Index ETF for further details. Neither Vanguard Investments Australia Ltd (ABN 72 072 881 086 AFSL 227263) nor its related entities, directors or officers give any guarantee as to the success Vanguard Australian Shares Index ETF, amount or timing of distributions, capital growth or taxation consequences of investing in the Vanguard Australian Shares Index ETF.

This publication was prepared in good faith and we accept no liability for any errors or omissions.

© 2024 Vanguard Investments Australia Ltd. All rights reserved.


Tony Kaye, Senior Personal Finance Writer
March 2024
vanguard.com.au
 

Most of our new clients are referred by our loyal, existing clients.